Career Research & Multimedia/Databases
Final Career Research
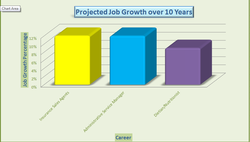
After finishing my career research, I reviewed all of my choices and data and came to a decision between three careers. In this assignment I gathered all of my information from my career analysis and inserted the data into a spreadsheet using Excel. In the spreasheet I charted three different categories: projected job growth, education requirements and the average salary for each career in the first sheet. Then for each category I created and designed a bar chart to display my career data. Technology skills that I used in this assignment were formatted and displaying data in excel by creating charts. Also I created, designed and formatted different bar charts for each category. Some of these skills included: changing font colors, inserting data into excel, copying and pasting data to create a chart, changing the design of a chart, rotating text direction and inserting shading and shadowing into the bar graphs. By creating these excel sheets, I learned how to plot data in Excel and how to use the data to create charts. I think in this activity I designed my bar charts exceptionally well using different formatting tools to make them look appropriate and colorful. To improve upon my work I would change my charts in a way to show more data or add more formatting skills into my first sheet which shows my data for each category.
Career Job Ad Glog
Visit my career job ad for my top career choice here: http://kjordan12.edu.glogster.com/jordankcareerad/
